Creates an object to hold probabilistic sensitivity analysis data, while checking the data for validity. The object can then be used for many standard cost-effectiveness analyses (see Details below).
Usage
make_psa_obj(
  cost,
  effectiveness,
  parameters = NULL,
  strategies = NULL,
  currency = "$",
  other_outcome = NULL
)
Arguments
- cost
For the data.frame, each simulation should be a row and each strategy should be a column. Naming the columns of the data frames is not necessary, as they will be renamed with the
strategiesvector.- effectiveness
For the data.frame, each simulation should be a row and each strategy should be a column. Naming the columns of the data frames is not necessary, as they will be renamed with the
strategiesvector.- parameters
Data frame with values for each simulation (rows) and parameter (columns). The column names should be the parameter names.
- strategies
vector with the names of the strategies, in the same order as the columns of the outcome data frames. Names are kept exactly as provided, so they can contain spaces and other characters (for example "Standard of care"), and are used as labels in tables and plots. They must be unique and not missing or empty. If
NULL, strategies are namedStrategy_1,Strategy_2, and so on.- currency
symbol for the currency being used (ex. "$", "£")
- other_outcome
data.frame containing values for another user-defined outcome. Each simulation should be a row of the data frame, and each strategy should be a column. Naming the columns of the data frames is not necessary, as they will be renamed with the
strategiesvector.
Details
The PSA object forms the backbone of one part of the dampack package.
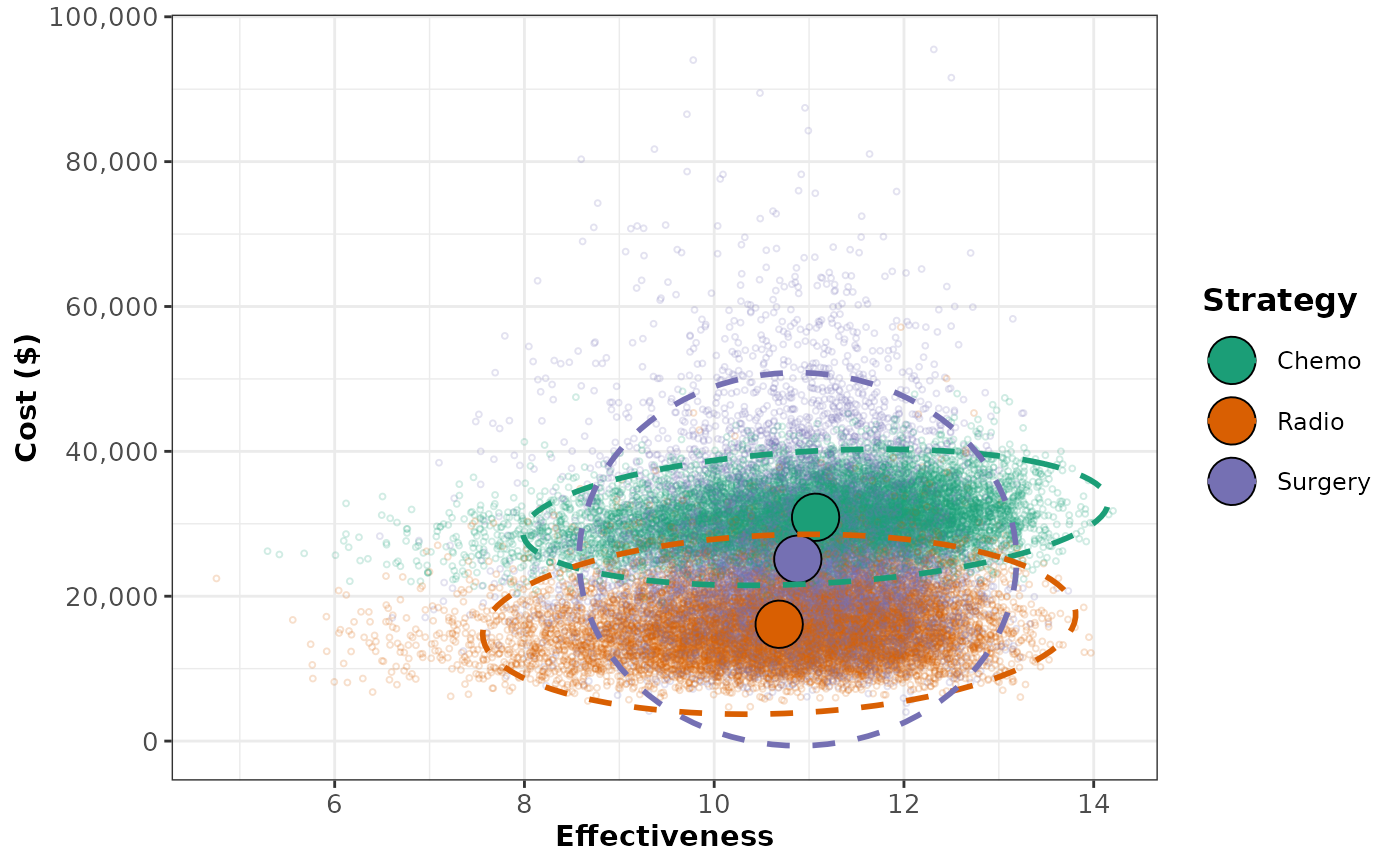
A scatterplot of the cost-effectiveness plane may be shown by running plot
on the output of make_psa_obj.
Using this object, you may calculate:
Cost-effectiveness acceptability curves (
ceac)Expected value of perfect information (
calc_evpi)Expected loss (
calc_exp_loss)One-way sensitivity analysis (
owsa)Two-way sensitivity analysis (
twsa)Metamodels (
metamodel)
In addition, the PSA may be converted to a base-case analysis by using summary
on the PSA object. The output of summary can be used in calculate_icers.
Examples
# psa input provided with package
data("cancer_psa_data")
psa <- make_psa_obj(cost = cancer_psa_data$cost,
                    effectiveness = cancer_psa_data$effectiveness,
                    parameters = cancer_psa_data$parameters,
                    strategies = cancer_psa_data$strategies)

# custom print and summary methods
print(psa)
#>
#> PSA object
#> -------------------------------------------------
#> number of strategies (n_strategies): 3
#> strategies: Chemo, Radio, Surgery
#> number of simulations (n_sim): 10000
#> cost: a data frame with 10000 rows and 3 columns.
#> effectiveness: a data frame with 10000 rows and 3 columns.
#> parameters: a data frame with 10000 rows and 8 columns
#> parameter names (parnames):  pFailChemo, pFailRadio, pFailSurg, pDieSurg, muDieCancer, cChemo, cRadio, cSurg
#> currency: $
summary(psa)
#>   Strategy meanCost meanEffect
#> 1    Chemo 30900.80   11.06869
#> 2    Radio 16128.88   10.68492
#> 3  Surgery 25110.22   10.88120

# custom plot method; see ?plot.psa for options
plot(psa)