Calculate the expected loss at a range of willingness-to-pay thresholds
Source:R/exp_loss.R
calc_exp_loss.RdThe expected loss is the quantification of the foregone benefits when choosing a suboptimal strategy given current evidence.
Arguments
- psa
object of class
psa, produced by functionmake_psa_obj- wtp
vector of willingness to pay thresholds
Details
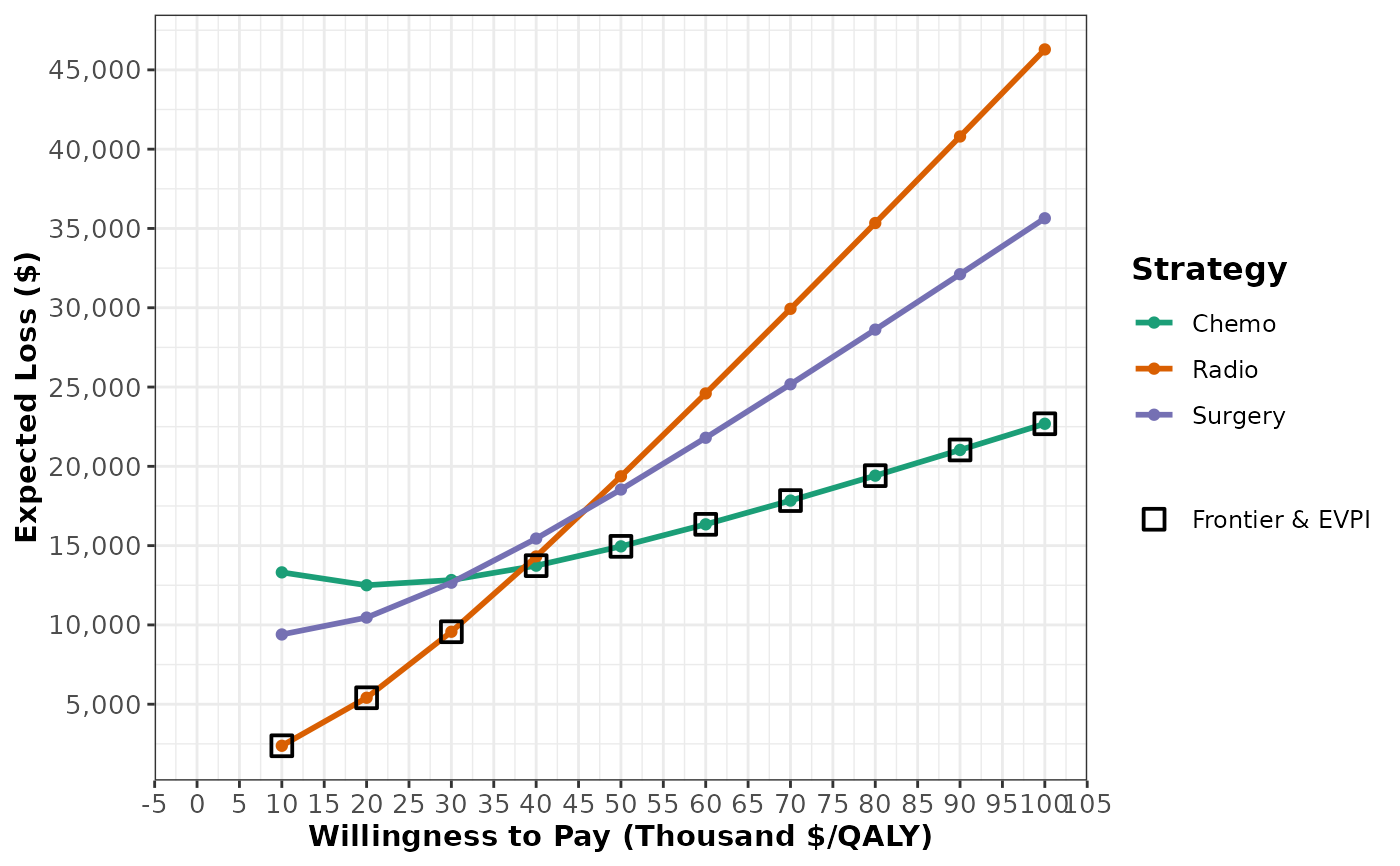
Visualize the expected loss at a variety of WTP thresholds using plot.exp_loss.
References
Alarid-Escudero F, Enns EA, Kuntz KM, Michaud TL, Jalal H. "Time Traveling Is Just Too Dangerous" But Some Methods Are Worth Revisiting: The Advantages of Expected Loss Curves Over Cost-Effectiveness Acceptability Curves and Frontier. Value Health. 2019;22(5):611-618.
Eckermann S, Briggs A, Willan AR. Health technology assessment in the cost- disutility plane. Med Decis Making. 2008;28(2):172–181.
Examples
data("cancer_psa_data")
psa_cancer <- make_psa_obj(cost = cancer_psa_data$cost,
effectiveness = cancer_psa_data$effectiveness,
parameters = cancer_psa_data$parameters,
strategies = cancer_psa_data$strategies)
wtp <- seq(1e4, 1e5, by = 1e4)
exp_loss <- calc_exp_loss(psa_cancer, wtp)
# can use head(), summary(), print(), etc.
head(exp_loss)
#> WTP Strategy Expected_Loss On_Frontier
#> 1 10000 Chemo 13313.249 FALSE
#> 2 10000 Radio 2378.997 TRUE
#> 3 10000 Surgery 9397.499 FALSE
#> 4 20000 Chemo 12502.981 FALSE
#> 5 20000 Radio 5406.398 TRUE
#> 6 20000 Surgery 10462.064 FALSE
# plot an expected loss curve (ELC)
plot(exp_loss)
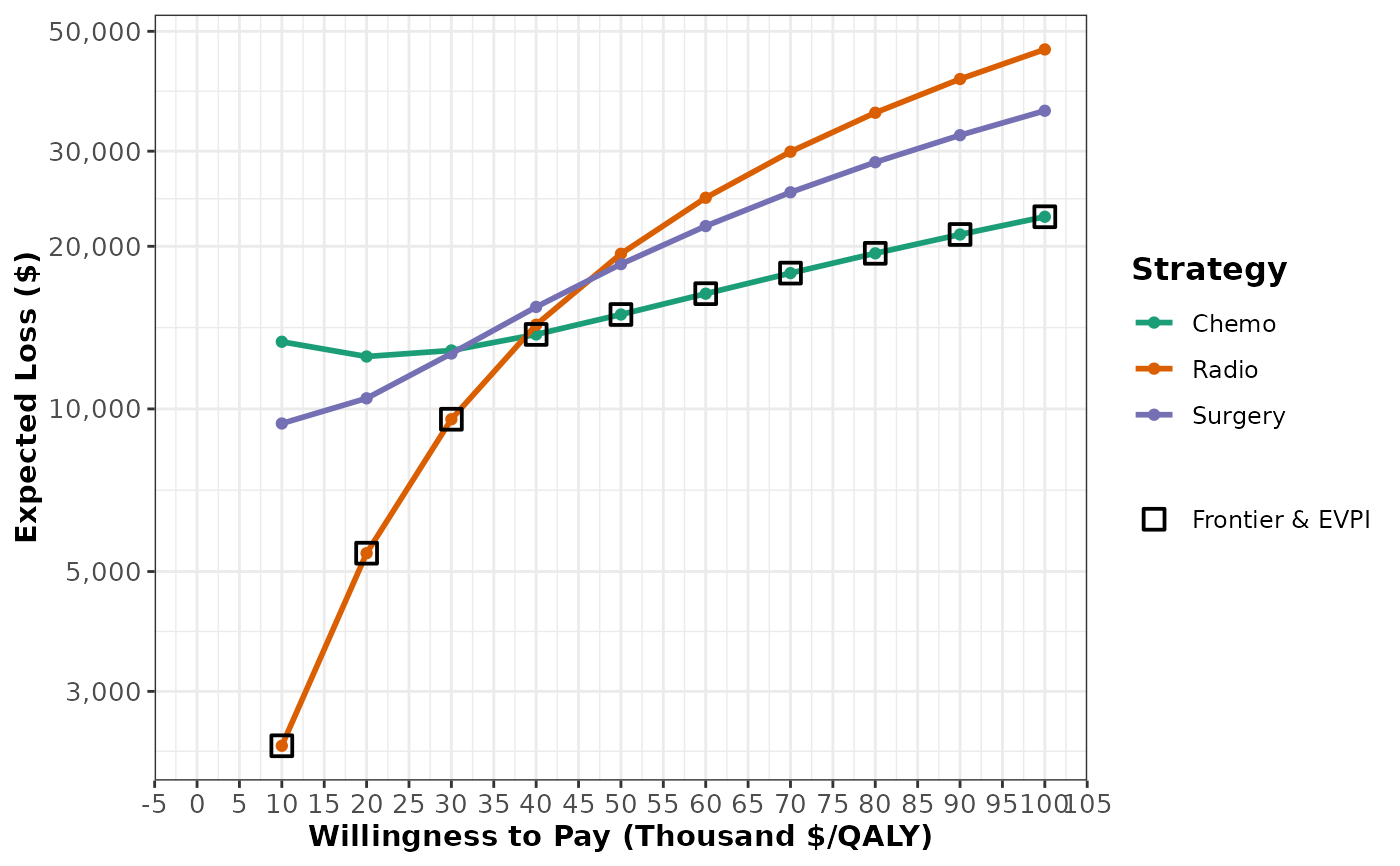 # the y axis is on a log scale by default
plot(exp_loss, log_y = FALSE)