ceac is used to compute and plot the cost-effectiveness acceptability
curves (CEAC) from a probabilistic sensitivity analysis (PSA) dataset.
Arguments
- wtp
numeric vector with willingness-to-pay (WTP) thresholds
- psa
psa object from
make_psa_obj
Value
An object of class ceac that can be visualized with plot. The ceac
object is a data.frame that shows the proportion of PSA samples for which each strategy at each
WTP threshold is cost-effective. The final column indicates whether or not the strategy at a
particular WTP is on the cost-efficient frontier.
Details
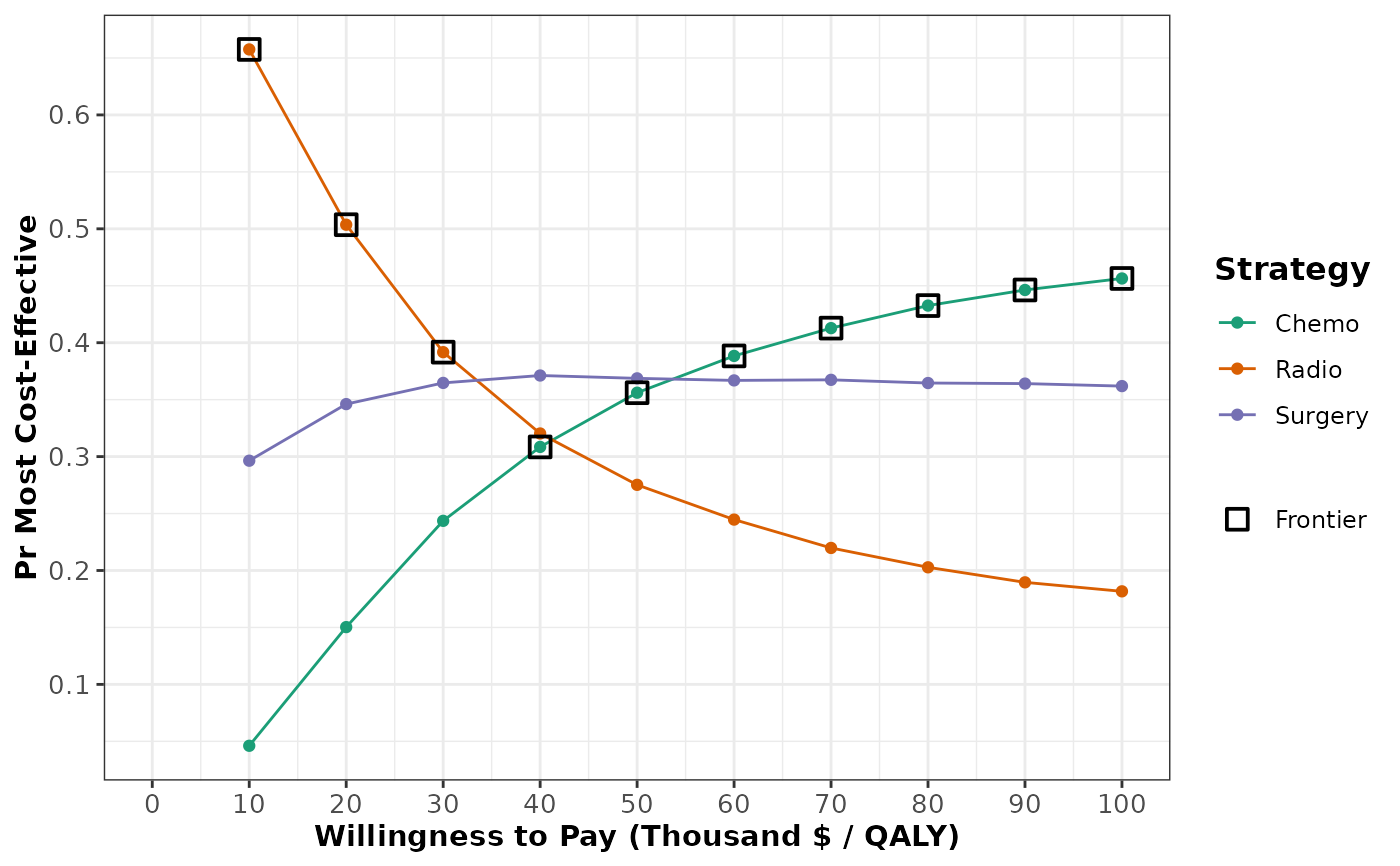
ceac computes the probability of each of the strategies being
cost-effective at each wtp threshold. The returned object has classes
ceac and data.frame, and has its own plot method (plot.ceac).
Examples
# psa input provided with package
data("cancer_psa_data")
psa_cancer <- make_psa_obj(cost = cancer_psa_data$cost,
effectiveness = cancer_psa_data$effectiveness,
parameters = cancer_psa_data$parameters,
strategies = cancer_psa_data$strategies)
# define wtp threshold vector (can also use a single wtp)
wtp <- seq(1e4, 1e5, by = 1e4)
ceac_obj <- ceac(wtp, psa_cancer)
plot(ceac_obj) # see ?plot.ceac for options
 # this is most useful when there are many strategies
# warnings are printed to describe strategies that
# have been filtered out
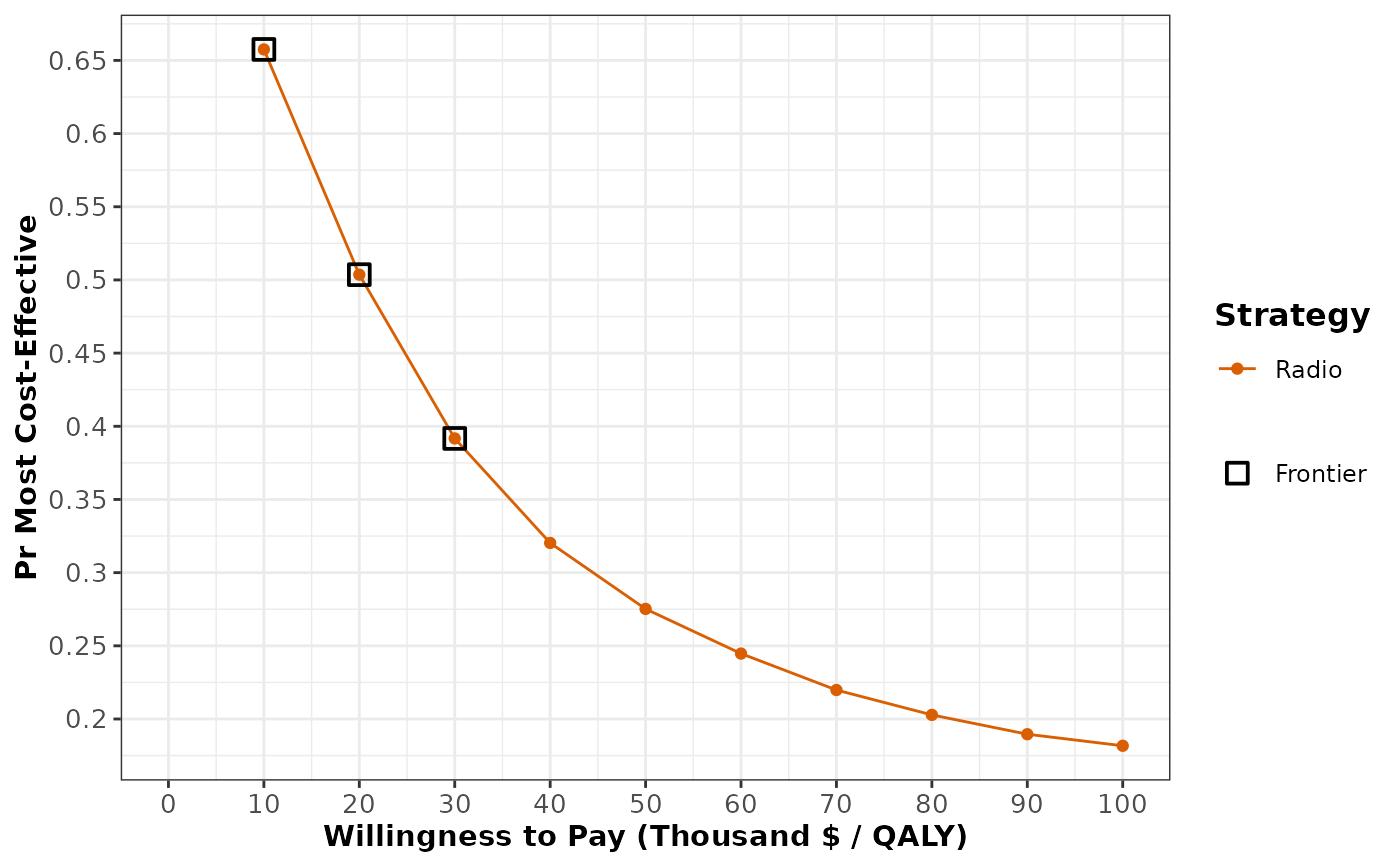
plot(ceac_obj, min_prob = 0.5)
#> filtered out 2 strategies with max prob below 0.5:
#> Chemo,Surgery
#> WARNING - some strategies that were filtered out are on the frontier:
#> Chemo
 # standard ggplot layers can be used
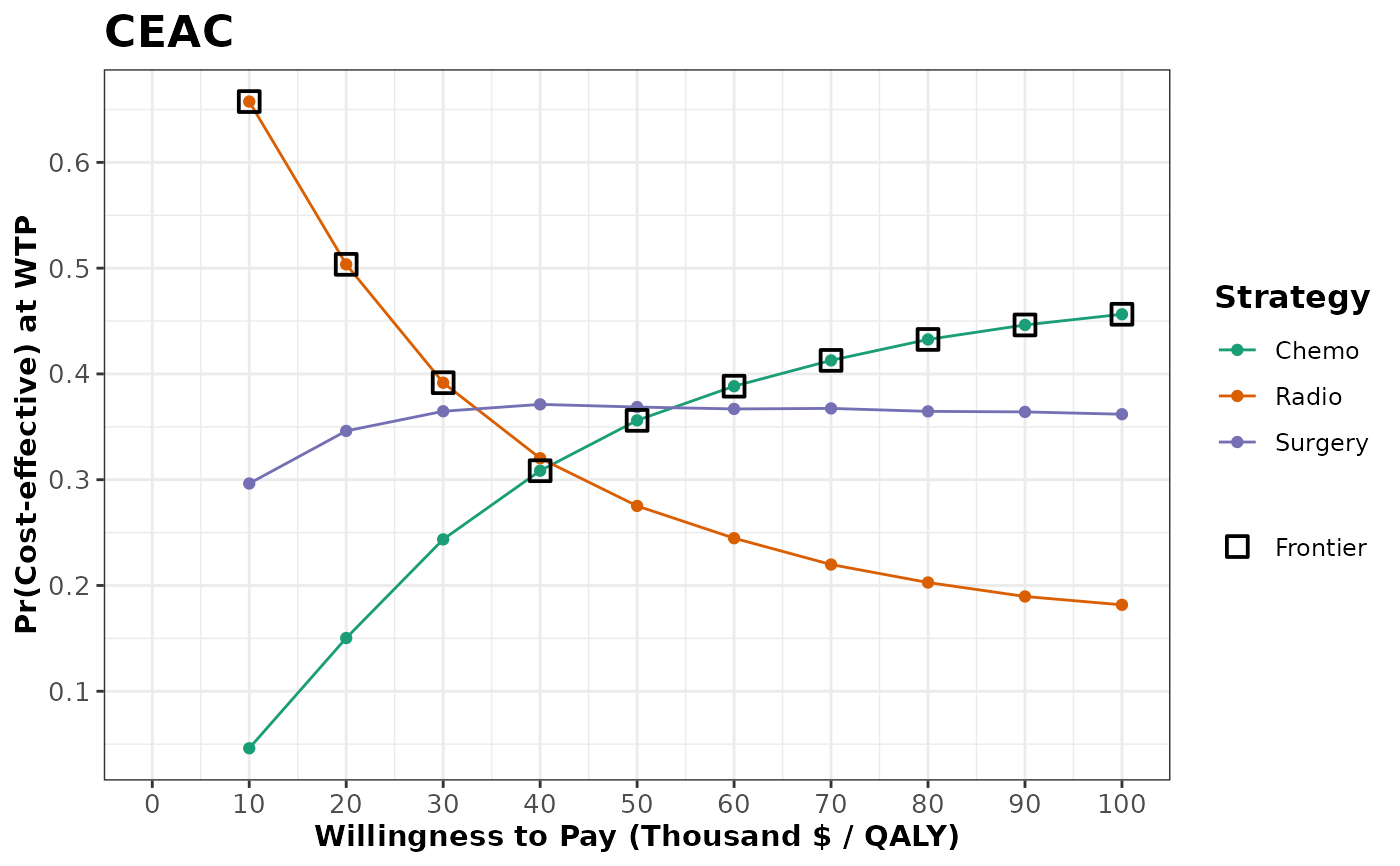
plot(ceac_obj) +
labs(title = "CEAC", y = "Pr(Cost-effective) at WTP")
 # the ceac object is also a data frame
head(ceac_obj)
#> WTP Strategy Proportion On_Frontier
#> 1 10000 Chemo 0.0461 FALSE
#> 2 10000 Radio 0.6575 TRUE
#> 3 10000 Surgery 0.2964 FALSE
#> 4 20000 Chemo 0.1503 FALSE
#> 5 20000 Radio 0.5036 TRUE
#> 6 20000 Surgery 0.3461 FALSE
# summary() tells us the regions of cost-effectiveness for each strategy.
# Note that the range_max column is an open parenthesis, meaning that the
# interval over which that strategy is cost-effective goes up to but does not include
# the value in the range_max column.
summary(ceac_obj)
#> range_min range_max optimal_strategy
#> 1 10000 4e+04 Radio
#> 2 40000 1e+05 Chemo