Cost and effectiveness of 100 hypothetical strategies, generated to illustrate and test
calculate_icers with many strategies. The values do not come from a decision
model, so the strategies have no clinical meaning. Most of them are dominated: with
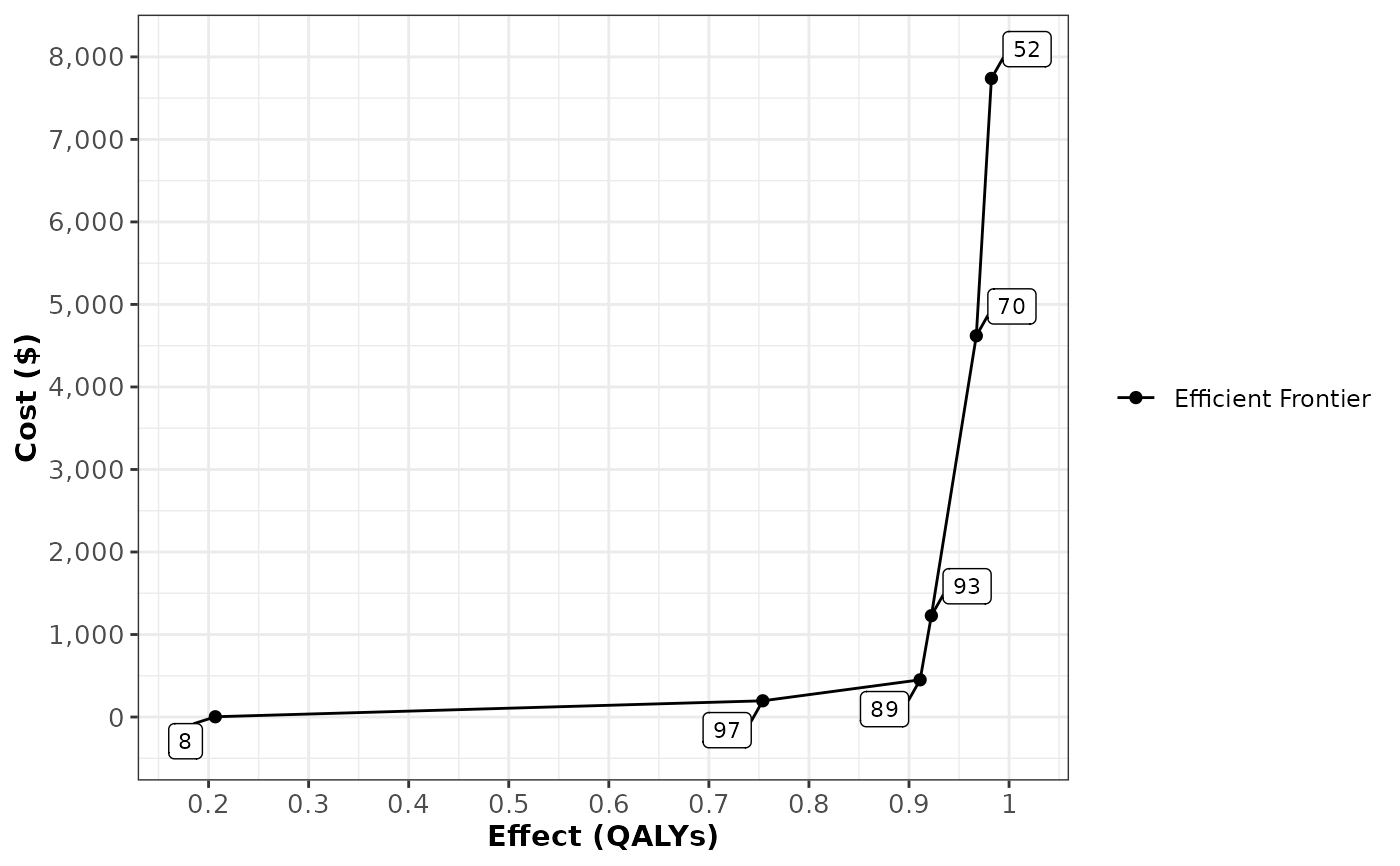
calculate_icers(), 90 are dominated, 4 are extendedly dominated, and 6 are on the
efficient frontier.
Format
A data frame with 100 rows (one per strategy) and 3 columns:
- Strategy
strategy number, an integer from 1 to 100.
- Cost
cost of the strategy, between 0 and 10,000.
- QALYs
effectiveness of the strategy in quality-adjusted life-years, between 0 and 1.
Examples
data(hund_strat)
hund_icers <- calculate_icers(hund_strat$Cost, hund_strat$QALYs, hund_strat$Strategy)
table(hund_icers$Status)
#>
#>  D ED ND
#> 90  4  6
plot(hund_icers, plot_frontier_only = TRUE)