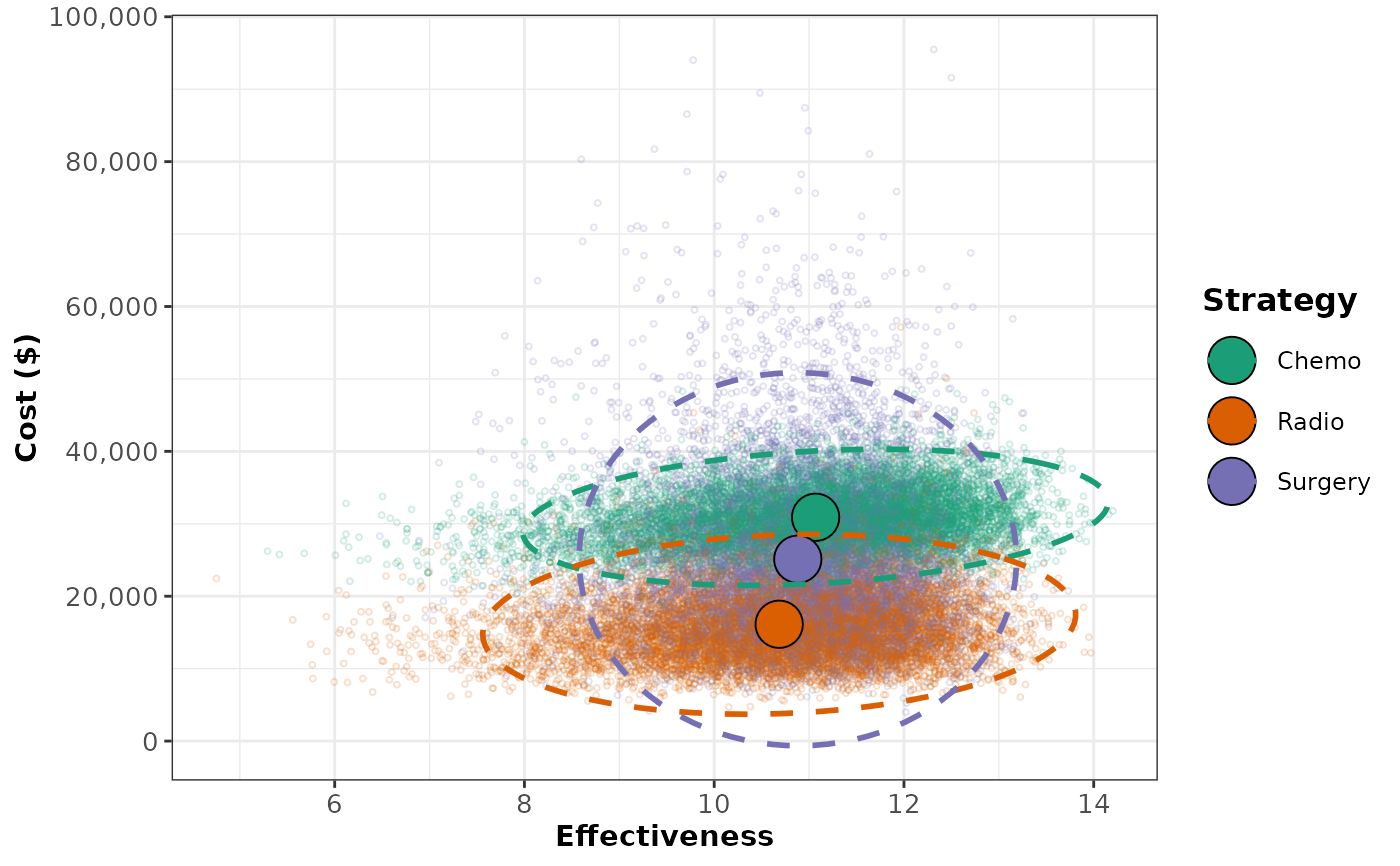
PSA output from a model of three cancer treatments
Source:R/data_cancer_psa_data.R
cancer_psa_data.RdProbabilistic sensitivity analysis (PSA) output from an illustrative
decision model comparing three treatments for cancer: chemotherapy,
radiation, and surgery. It contains the strategy names, the cost and
effectiveness of each strategy in each of 10,000 PSA samples, and the
values of the 8 model parameters drawn in each sample. It is the main
example dataset used throughout the dampack examples and vignettes.
Format
A list with 4 elements:
- strategies
character vector of the 3 strategy names:
"Chemo","Radio", and"Surgery".- cost
data frame with 10,000 rows (PSA samples) and 3 columns (
Chemo_Cost,Radio_Cost,Surg_Cost) with the cost of each strategy, in the same order asstrategies.- effectiveness
data frame with 10,000 rows and 3 columns (
Chemo_Eff,Radio_Eff,Surg_Eff) with the effectiveness of each strategy, in the same order asstrategies.- parameters
data frame with 10,000 rows and 8 columns with the parameter values drawn in each PSA sample:
- pFailChemo
probability of treatment failure with chemotherapy
- pFailRadio
probability of treatment failure with radiation
- pFailSurg
probability of treatment failure with surgery
- pDieSurg
probability of dying from surgery
- muDieCancer
cancer-specific mortality
- cChemo
cost of chemotherapy
- cRadio
cost of radiation
- cSurg
cost of surgery
Details
This dataset replaces example_psa and
example_psa_obj, which contain the same PSA samples and are
kept only for backward compatibility.
See also
make_psa_obj to build a psa object from this
dataset, and vignette("psa_analysis", package = "dampack").
Examples
data("cancer_psa_data")
psa_cancer <- make_psa_obj(cost = cancer_psa_data$cost,
                           effectiveness = cancer_psa_data$effectiveness,
                           parameters = cancer_psa_data$parameters,
                           strategies = cancer_psa_data$strategies)
plot(psa_cancer)